How It Works Get Started

Everything exists. Nothing connects it.
We do.

An F&B decision engine connecting revenue, cost, and guest sentiment in real time.
Agents that act. dashboards that wait.
WhiteSpace.
Scroll to explore
Integrations

Built to fit your ecosystem

Seamlessly connect WhiteSpace with the POS and tools you already use. No migration, no disruption.

  • POS Systems
  • CSV & Excel Imports
  • Review Platforms
WS
Loyverse
Square
Light
speed
Toast
Revo
XEF
Revel
Aldelo
Zettle
Papaya
Store
Hub
Wongnai
SumUp
Food
Story
Epos
Now
Poster
CSV
The Product

This is your console.

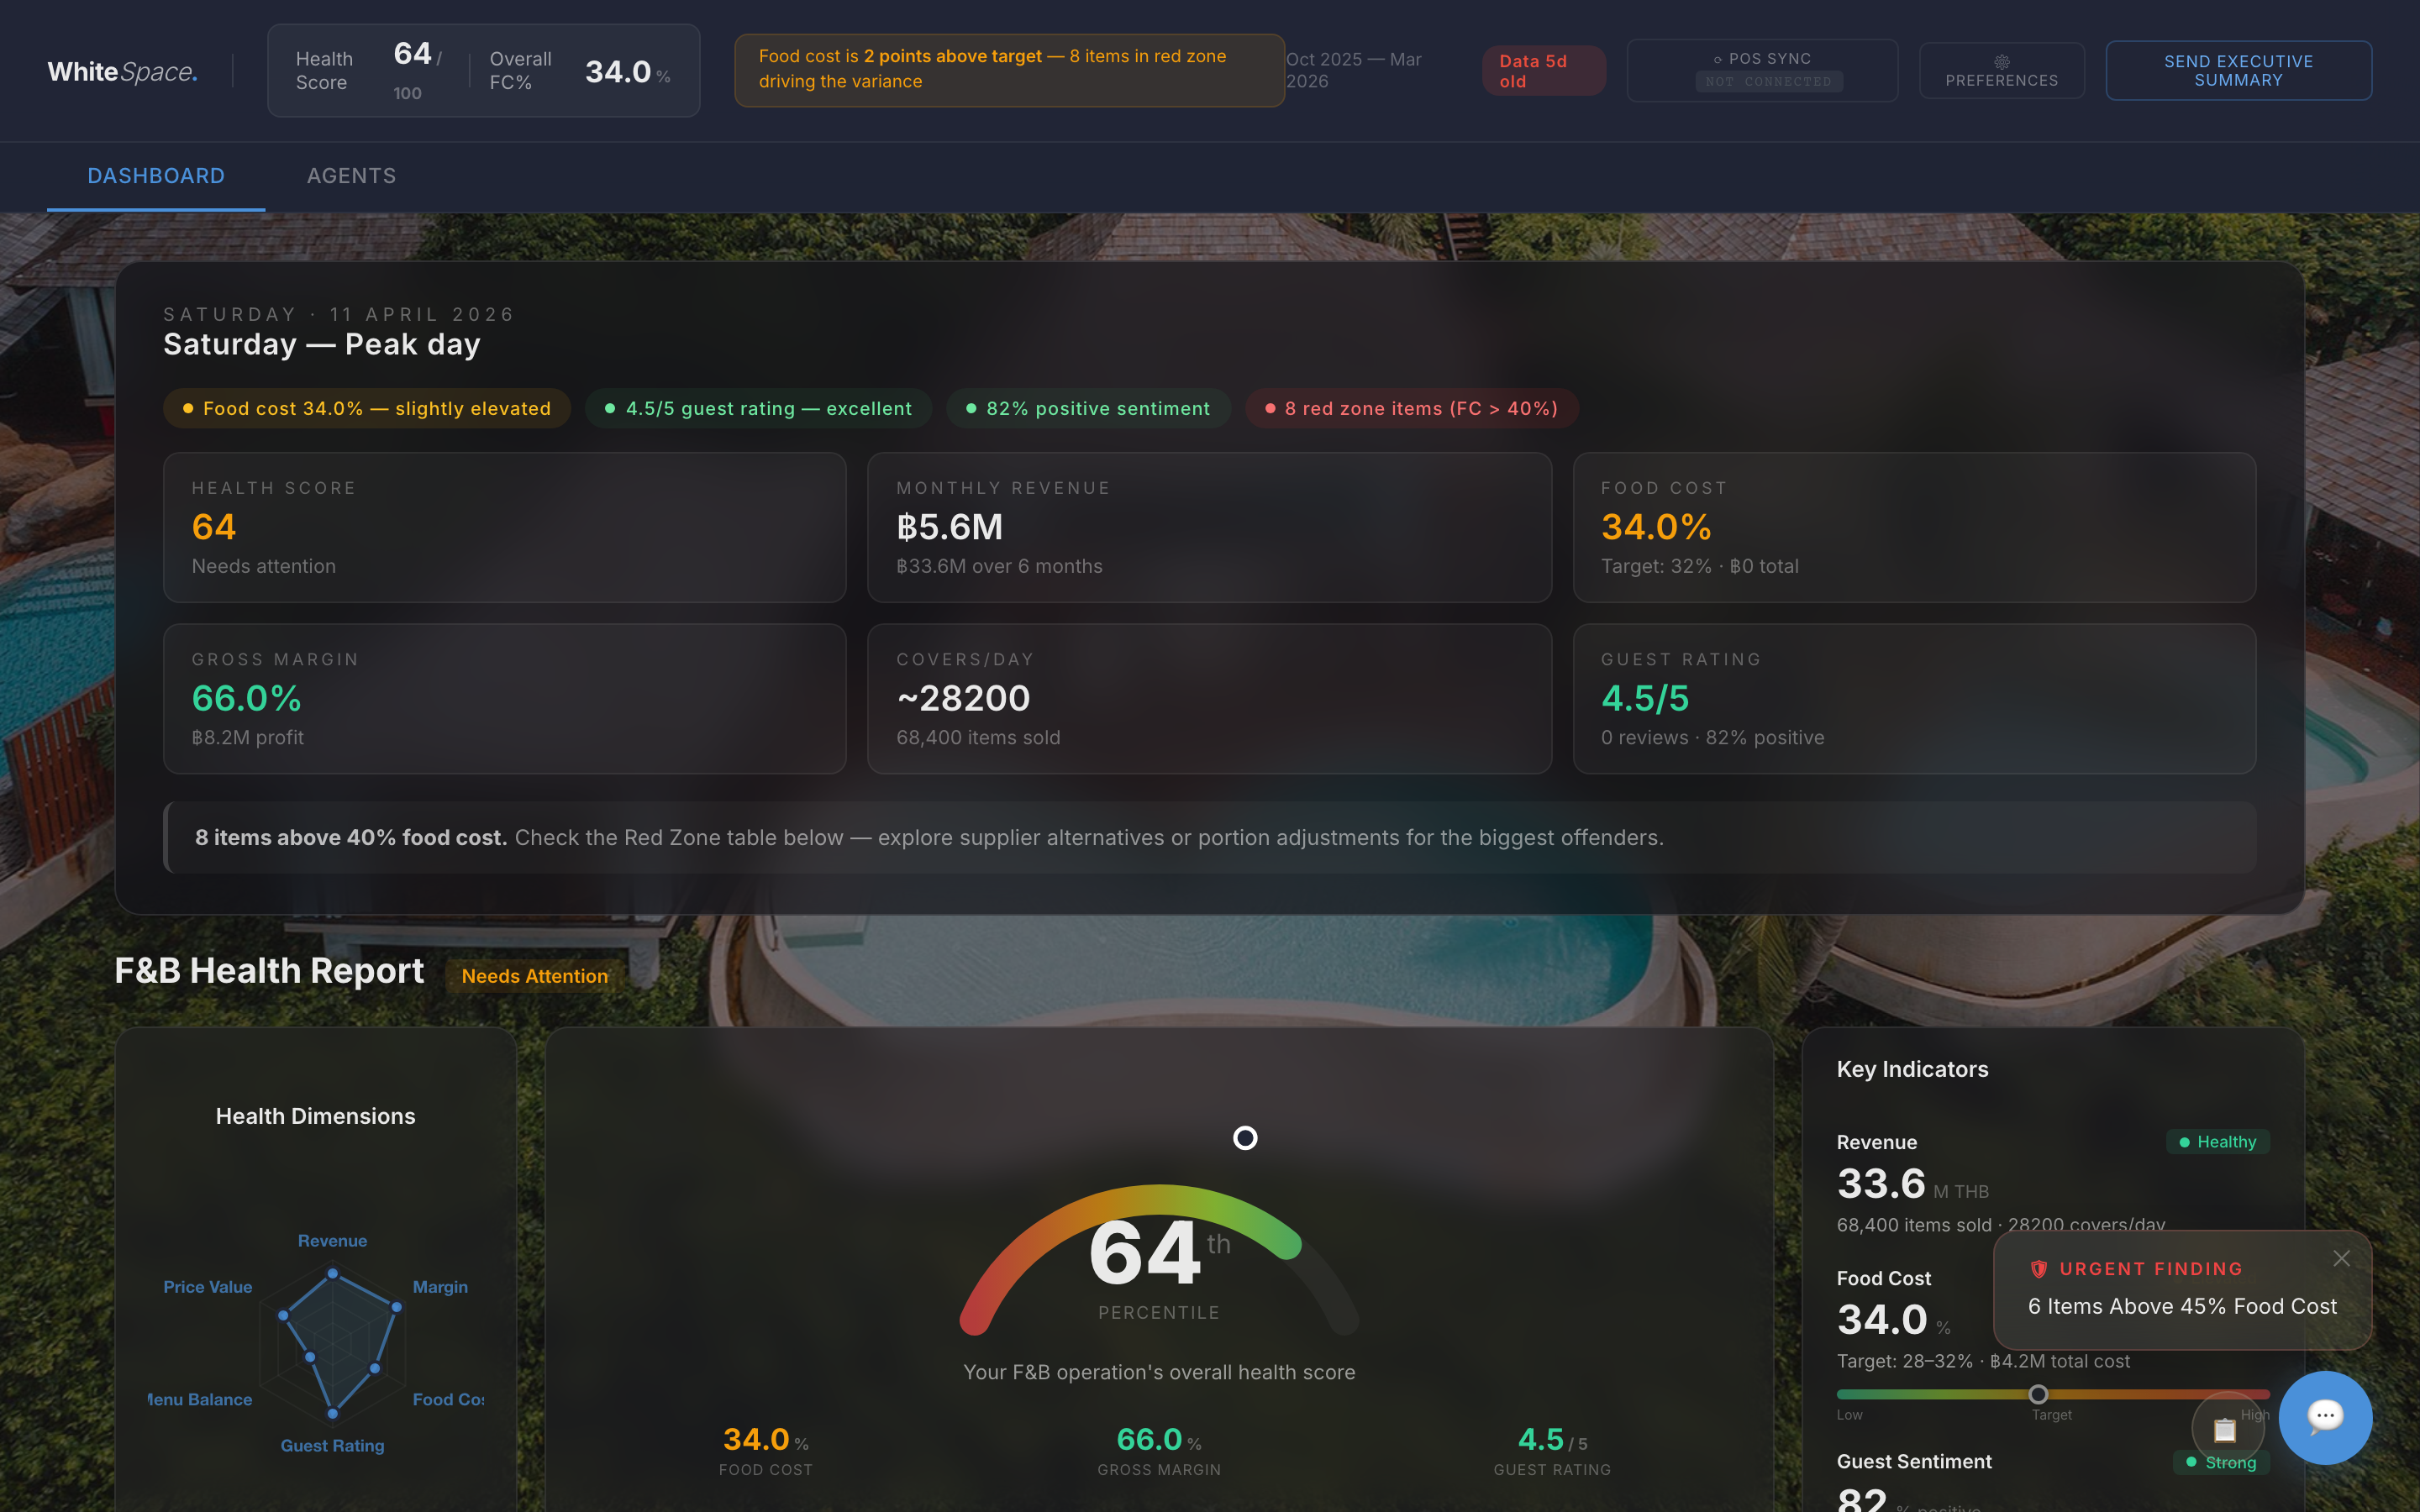
Health score, diagnostics, risk indicators, and AI agents. A vital signs monitor for your F&B.

whitespacefb.com — F&B Health Monitor
WhiteSpace health monitor console showing F&B vitals, diagnostics, and AI agent alerts for a resort

Ask WhiteSpace anything. She answers with your numbers.

Vera — Finance mode responding
WhiteSpace AI advisor chat showing Finance mode analysing food cost data
Try the live demo

Four separate truths.
Zero conversation between them.

Twenty years operating hotels with multiple outlets in Europe and SEA. The data was always there. POS exports, cost sheets, guest reviews, procurement logs, payroll reports. Scattered across five systems, three managers, and a dozen spreadsheets nobody opens at the same time.

But the real problem was never missing data. It was the filter. Every connection between those numbers ran through a GM, a chef, an owner. Each shaped by their background, their preferences, their blind spots. The GM who came from fine dining couldn't see a cost problem. The owner who built the place around a signature dish would never flag it as a margin leak. Same numbers, different people, different truths.

Subjective is expensive. A supplier quietly substitutes a protein. Guest complaints surface on a platform nobody checks. The costing sheet hasn't been touched in weeks. Four separate truths. Procurement, costing, sentiment, operations. Sitting in four separate silos, connected only by whoever happened to be paying attention that day.

So I built the thing that doesn't have a background. Doesn't have a favourite dish. Doesn't have a bias. It reads the numbers, the reviews, the costs, the patterns and connects them without a filter. Not a dashboard to stare at. An intelligence that works the floor while you work the room.

20
Years in F&B
Hotels
Multi-outlet operations
Thailand
Built here first
POS export → map → console
48hrs setup
no passwords. no integrations.
sentiment: 86% pos
★ 4.3 / 5.0
response rate: 45% ← fix this
Q: "why is seafood margin low?"
A: portion size ↑ 15%
supplier cost +8% since Jan
🔒 encrypted
🔒 private
🔒 yours
Excel → intelligence
step 1: share (you choose what)
step 2: we build (private)
step 3: agents work (24/7)
step 4: you decide

Your data stays yours.
Here's how we work together.

STEP 01

Share what you're comfortable with

A POS export, a cost sheet, even a messy Excel file. Whatever you already have. Send it by WhatsApp or email. No integrations, no system access, no passwords. You decide what to share and when.

STEP 02

We build your private console

Your data is mapped to a private dashboard. Only you can access it. No data is shared between clients, ever. Your numbers, your brand, your outlets. Updated with every reporting cycle.

STEP 03

An advisor that thinks like an operator

Three specialist modes (Finance, Pulse, Ops) that diagnose before prescribing. They read the room, anchor to this week's data, and speak with conviction. Your data only. Nothing is used to train AI models.

STEP 04

You ask, they remember

Ask anything in plain language. "Why is seafood margin low?" "What should we promote this week?" Vera responds with specific numbers and recommended actions. She remembers your preferences, past conversations, and decisions. No repeating yourself. No reconfiguring.

STEP 05

Scheduled reports, delivered

Agents run a scheduled analysis on your latest data and push findings straight to your WhatsApp or LINE. No login required. You wake up to what changed, what needs attention, and what to do about it.

red zone items:
Wagyu → 62% FC
Lobster → 58% FC
Truffle pasta → 49%
↑ reprice or cut
upsell pairing:
Tom Yum + Thai iced tea
margin lift: +฿85/cover
推荐 → push to servers
"overpriced" × 12 reviews
actual FC: 34%
diagnosis: presentation
not pricing. not portion.
week 1: ฿38K saved
week 4: ฿142K saved
compound effect
sunset cocktail → 82% margin
most Instagrammed item
💡 what if...
pool bar menu
= only top margin items?
test next week

Not just what happened.
What to do about it.

Mode 01 / Finance

Follows the money from delivery to plate

  • Cost spikes diagnosed, not just flagged
  • Red-zone itemsMenu items with food cost above your target (typically 40%+). High cost doesn't always mean bad. It could be a signature dish. with trade-off analysis
  • Payroll driftWhen labour costs creep up relative to revenue. Often invisible until it's too late. Restaurants target 20-25%, bars 35-45%. vs revenue patterns
  • Supplier price trajectory tracking
  • Conviction-based recommendations
Mode 02 / Pulse

Thinks like a guest who just finished dinner

  • Guest sentiment connected to margin data
  • "Overpriced" vs actual food cost diagnosis
  • Revenue hiding in plain sight
  • Menu engineeringThe Kasavana-Smith matrix classifies every menu item into Stars (high profit, high popularity), Plowhorses (low profit, high popularity), Puzzles (high profit, low popularity), and Dogs (low both). (Kasavana-Smith)
  • Presentation vs pricing analysis
Mode 03 / Ops

Thinks like a director reviewing the week

  • Demand pattern and staffing analysis
  • Supplier concentration risk alerts
  • Break-even and seasonal tracking
  • Weekly performance diagnostics
  • The question the kitchen hoped nobody would ask
4 items above target
FC target: 35%
Beef Rib
77.7%
Grilled Octopus
61.2%
Curly Fries
60.5%
Beef Skirt Skewer
54.2%

Cost issues flagged before they cost you

Red-zone items, margin drift, and cost spikes — detected the moment they appear in your data.

Daily Avg Revenue
Soi 6 — Mar 2026
฿44.5K
Sun
฿44.1K
Mon
฿44.9K
Tue
฿44.2K
Wed
฿49.8K
Thu
฿47.3K
Fri
฿47.9K
Sat

Revenue opportunities you didn't see

Dead weekday slots, upsell pairings, high-margin items hiding in your data.

★★★☆☆
"Amazing views but plates feel small for the price"
Google
2 days ago
Actual FC
34%
Target: 32%
Vera: Cost is healthy. This is a plating perception issue — not pricing.

Guest feedback connected to your P&L

"Overpriced" + 34% food cost = presentation problem, not pricing. Agents connect the dots.

The Beef Rib is at 78% food cost — is it worth keeping?
Vera · Finance
It's your #1 seller at ฿423K revenue. Cutting it would lose ฿94K profit. Instead: negotiate beef price (currently ฿850/kg), or add a ฿195 high-margin side pairing. That drops effective FC to 61%.

Plain language, not dashboards full of charts

Ask a question, get a direct answer with numbers and a recommended action.

Dashboard Menu Reports Settings
Revenue
฿11.4M
+8% vs prev
Food Cost
40.2%
+5.2% above
Margin
59.8%
6-mo avg
V
Ask WhiteSpace anything about your data...
Send

Your data, your console, your brand

Every console is built for your property. Not a generic template.

Morning Briefing
Live
Saturday did ฿89K. That's 20% above your average Saturday.
MTD pace: 42% complete, need ฿58K/day to hit target.
YESTERDAY
฿89K
SAT AVG
฿74K
MARGIN
60%+
3-day streak

Updated every reporting cycle

Fresh data flows in, agents get smarter. No stale reports in a drawer.

Shelf Life Monitor
2 alerts
Hokkaido Scallops
1 day
Heavy Cream
2 days
Salmon Fillet
3 days
Angus Skirt
4 days
Olive Oil
180 d

Stock Intelligence — know what to order before you run out

Sales mix + recipes + shelf life = automatic waste alerts and reorder suggestions.

2 mismatches detected
Menu vs POS prices
Garlic Bread
259 299
+40
Green Curry
249 269
+20
Fish & Chips
349 349
OK

Price Guard — menu and POS always in sync

Automatic daily check compares your uploaded menu prices with what the POS is charging. Mismatches trigger an instant alert.

For You
Live
2 new red zone items — Beef Rib jumped to 68% FC
Food cost +3.2pp — above target since Tuesday
3 new reviews — sentiment up to 82%

What changed since you last opened

Every visit starts with a personalised "For You" feed — new red-zone items, cost shifts, revenue changes, review updates. Each insight is tappable to start a conversation with your AI agent.

Suggested Questions
new Beef Rib is at 68% FC — what are my options?
We have 4.9 stars but only 127 reviews — how do I get more?
If you ran this place, what would you change first?

Questions grounded in your data

No generic prompts. The chat suggests questions based on what actually happened — cost spikes, revenue drops, new reviews. Badged "new" when something changed since yesterday.

Your daily operating system.

Reports tell you what happened last month. Your console tells you what to do today. These features make it the first thing you open every morning.

Morning Check-in

Open your console.
Yesterday's story in 5 seconds.

Every morning, your console opens with a personalized briefing built from last night's data. Not static KPIs. Real context: how yesterday compared to your average for that day, whether you're on pace for the month, and what to watch for today.

  • Yesterday vs your average for that day of week
  • Month-to-date pace: on track, behind, or ahead of target
  • Streaks and shifts: cost creep, revenue runs, rating changes
  • Day-specific prep: what to expect based on your own history
Wednesday, 9 April 2026
Midweek check-in
Tuesday did ฿87K. That's your best Tuesday in 3 months.
9 days in, you're at 61% of your monthly target. Slightly behind pace.
Food cost has been under 32% for four days straight.
Yesterday
฿87K
avg Tue: ฿68K
MTD Pace
61%
need ฿72K/day
FC Streak
4 days
under target
Wednesday: Last three Wednesdays averaged 74 covers. You're trending higher this week. Make sure prep matches.
2 New Reviews
Dismiss All
★★★★★ Google
"Amazing poke bowls! The salmon was incredibly fresh and the portion size was generous. Will definitely come back."
Sarah M. · 2 hours ago Dismiss
★★★☆☆ Google
"Food was OK but waited 25 minutes for a poke bowl. Too long for a grab-and-go place."
James T. · 5 hours ago Dismiss
Live Review Alerts

Every review. The moment
it's posted.

A new Google or Facebook review appears, and your console shows it instantly. Stars, full text, reviewer name. Respond before the guest has left the parking lot. Bad review? You know in minutes, not days.

  • Google + Facebook reviews, polled every 30 minutes
  • Pop-up in your console + LINE/WhatsApp push
  • Dismiss individually or all at once
  • No extra app. It's built into your console
Delivery Intelligence

Your real margin after commissions

GrabFood charges 32%. LINE MAN charges 27%. Packaging costs ฿20 per order. Your menu says 65% margin, but on delivery it's 6%. We show you the real numbers per platform, per item.

Platform comparison Per-item profitability Loss-making items flagged
Multi-Property

All your locations, one console

Two branches? Five outlets? Each property gets its own P&L, its own data, its own agent analysis. All inside a single console. Compare locations side by side. Spot which one is dragging the average down.

Per-location P&L Cross-property comparison Unified agents

Your POS tells you what happened.
We tell you what to do about it.

Every POS has basic reports: revenue, top sellers, daily totals. That's the rearview mirror. WhiteSpace is the windshield.

Feature POS Reports WhiteSpace
Revenue & sales totals Yes Yes, plus trends, deltas, WoW/MoM
Menu engineering matrix No Kasavana-Smith: Stars, Puzzles, Plough Horses, Dogs. Auto-classified with actions
Red-zone item alerts No Items above 45% food cost flagged, with reprice/cut/portion recommendations
Contribution margin per item No Every item ranked by actual margin, not just revenue
Ask questions about your data No "Why is lobster killing my margin?" Instant data-backed answer
Weekly intelligence briefing No Top 3 actions pushed to your phone every Monday
Guest sentiment + financials Separate system "Overpriced" reviews vs actual 32% FC: it's perception, not pricing
Weekday pattern detection Manual Auto: "Mondays 22% below average. Run a promo or cut staff"
Business-type benchmarks No Restaurant payroll 22-28% vs bar 35-50%. Right benchmarks for your type
Recommendation tracking No Agents remember what they told you: pending, done, or dismissed

Works with your existing POS: Loyverse, Square, Toast, Lightspeed, and 11 more. We don't replace it. We make it smarter.
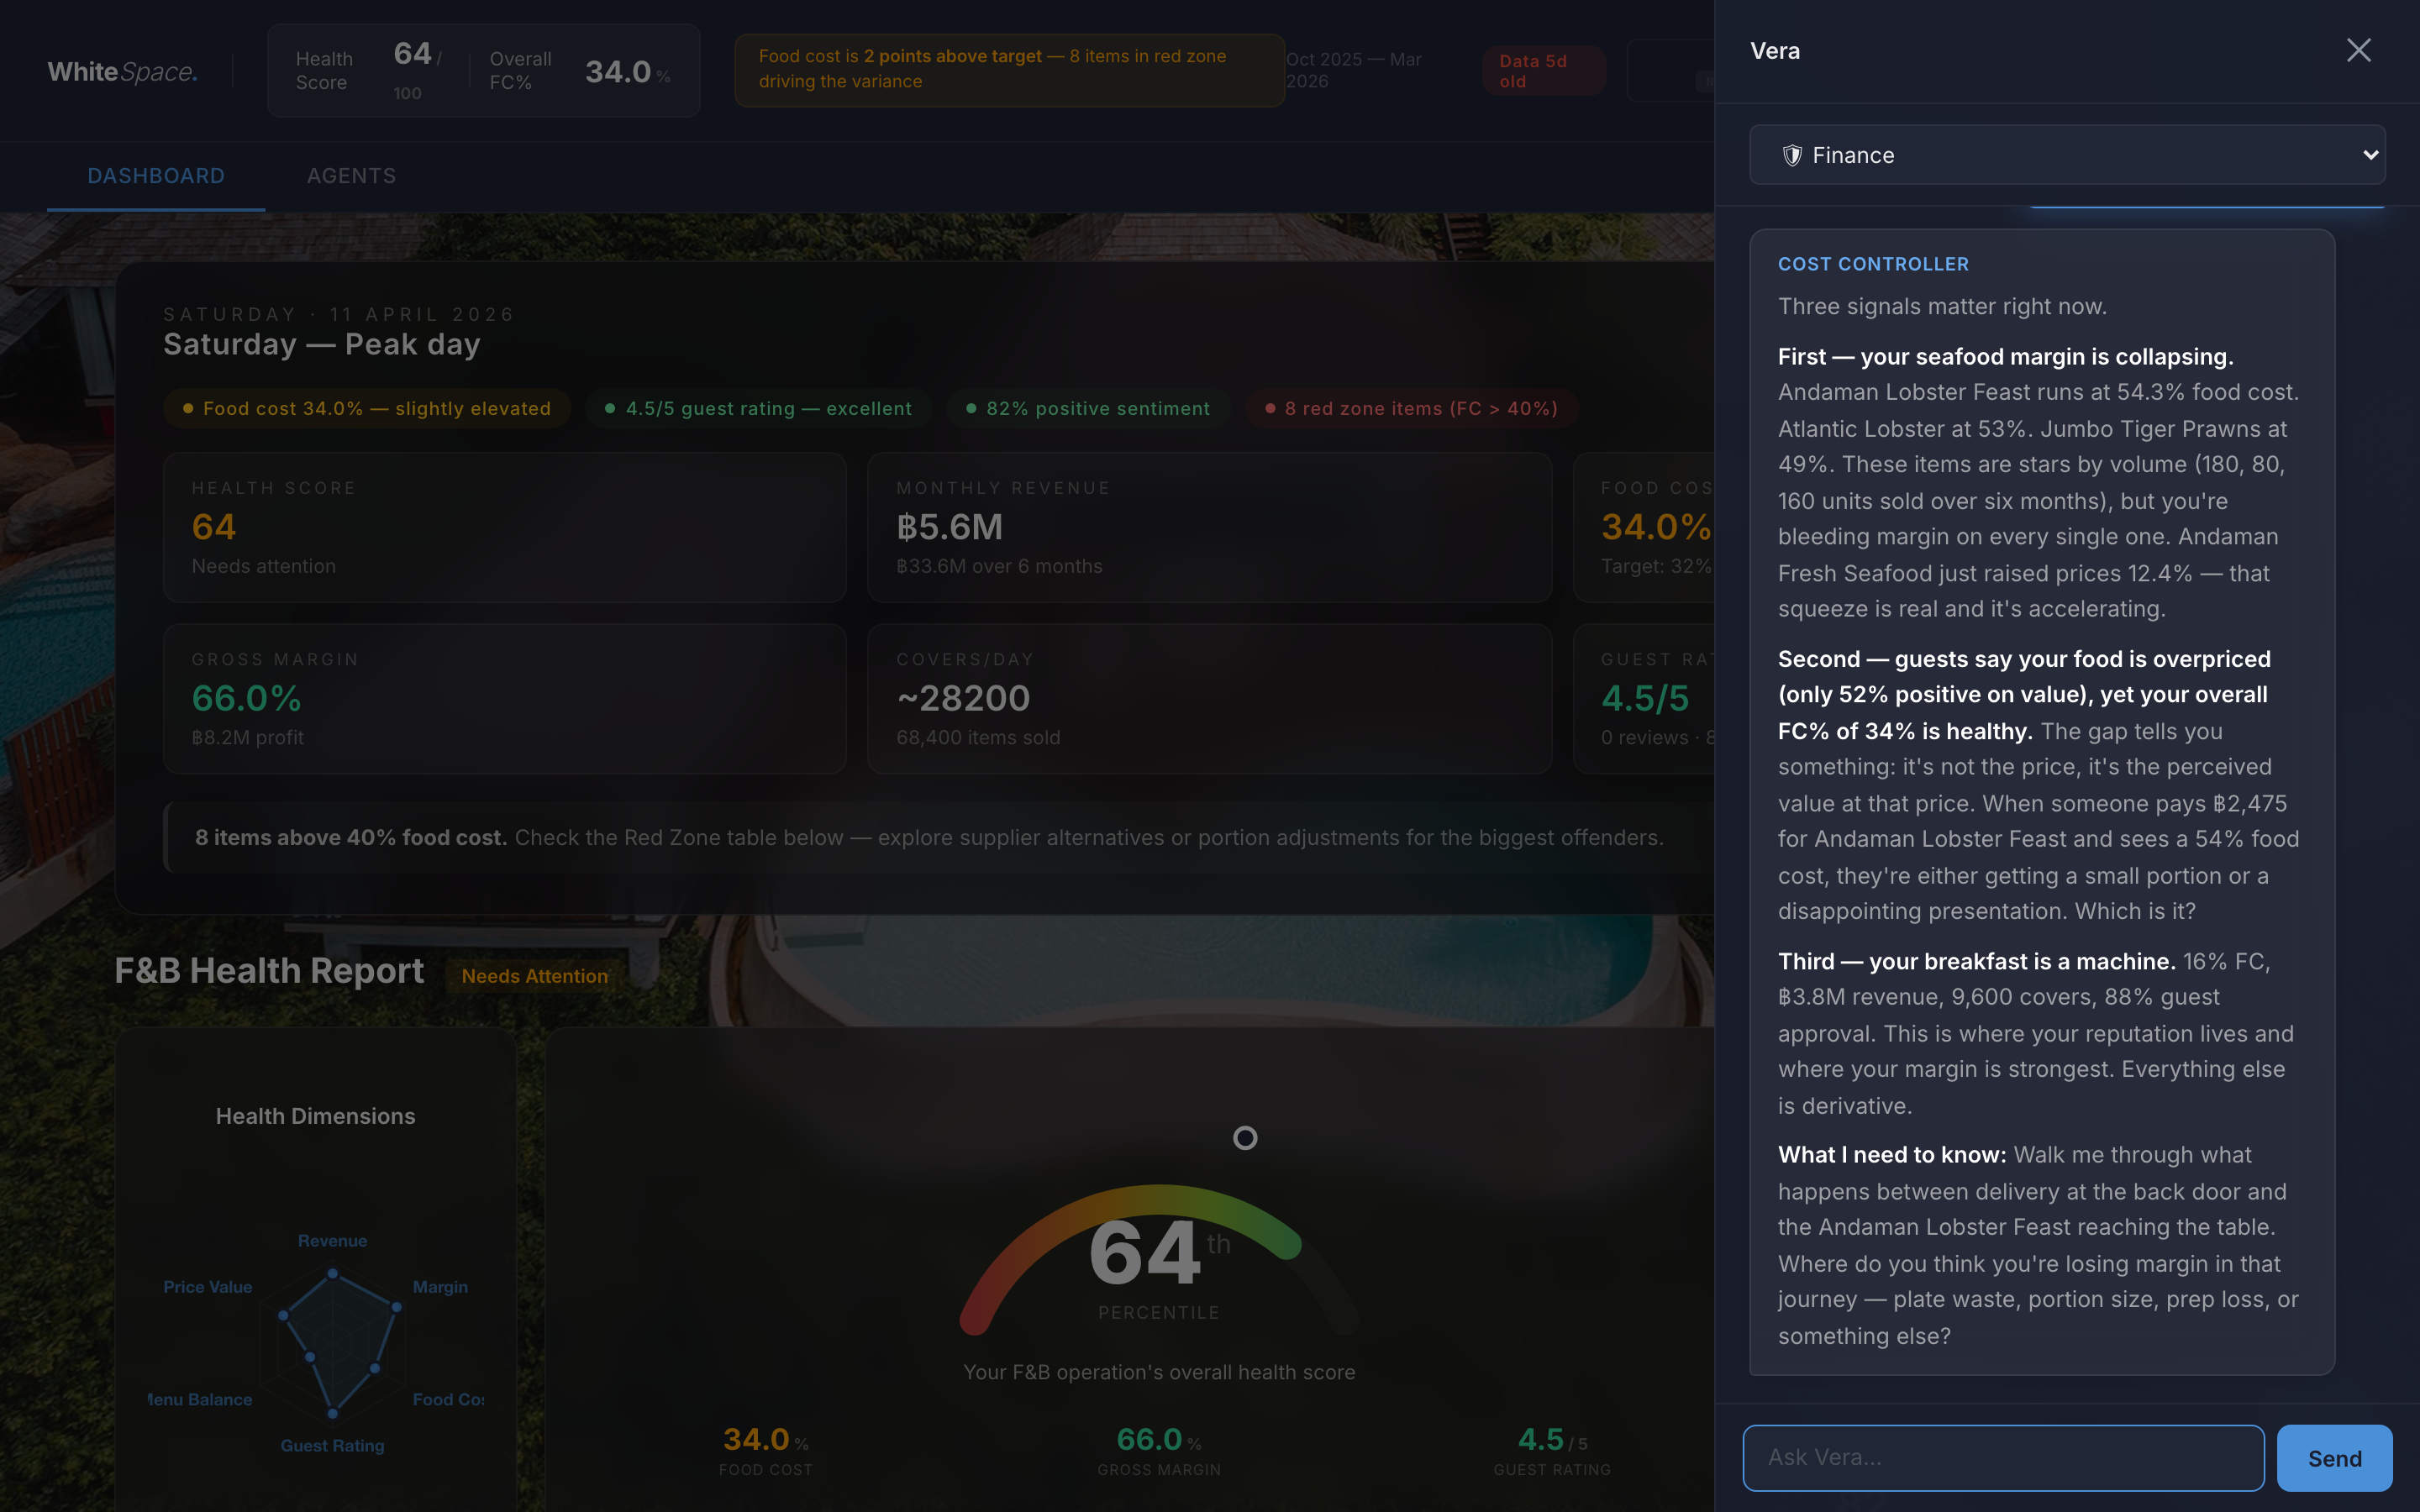
See all 43 metrics →
Every Monday 7 AM

Your agents work
while you sleep.

Agents run a scheduled analysis on your latest data and push findings via LINE, WhatsApp, or email. No login. No questions. You wake up Monday to:

Finance
Hokkaido Scallops hit 52% food cost, up from 49%. Your supplier raised the price ฿320/kg since January. Check this week's invoice before your next order goes out.
Pulse
In-Villa BBQ is your best margin at ฿3,915 per booking. Only 7 guests booked it last month. Your front desk team should be mentioning it at check-in.
Ops
Vegetable waste is running at 11%. That's double the benchmark and ฿98K lost over six months. Start with daily par sheets at Moon restaurant this week.
W
WhiteSpace
Monday 7:00 AM
Finance
Hokkaido Scallops hit 52% food cost, up from 49%. Your supplier raised the price ฿320/kg since January.
Check this week's invoice before your next order goes out.
7:00 AM
Pulse
In-Villa BBQ is your best margin at ฿3,915 per booking. Only 7 guests booked it last month.
Your front desk team should be mentioning it at check-in.
7:00 AM
Ops
Vegetable waste is running at 11%. That's double the benchmark and ฿98K lost over six months.
Start with daily par sheets at Moon restaurant this week.
7:00 AM
Message
Thai benchmarks:
food cost: 28-35%
bev cost: 18-24%
labour: 25-32%
where do you sit?
80/20 rule:
6 items = 80% revenue
the rest is noise
P&L ≠ tax return
P&L = operating truth

From the field.

Practical F&B intelligence for operators in Southeast Asia.

Featured / AI Agents

What Can AI Agents Actually Do for Hotel F&B?

Not theory. Real conversations with AI agents trained on an actual hotel's data. What they flag, what they recommend, and what they can't do.

Read →
Benchmark Report

Thailand F&B Cost Benchmarks

Food cost, bev cost, and labour benchmarks across 120+ Thai venues.

Read →
Back to Basics

What Is a P&L and Why Should You Care?

Where every baht goes, explained with a real Thai restaurant example.

Read →
Menu Strategy

The 80/20 Rule: You Only Have 6 Menu Items That Matter

Your menu has 40 dishes. Your revenue has 6 heroes. The rest is noise.

Read →
Operations

The Weekly Cash Ritual That Replaced My Gut Feeling

Five numbers. 30 minutes. Every Monday. That's the whole system.

Read →
Sales Analysis

How to Read Your Sales Mix

Not all revenue is equal. Your sales mix shows where the real margin lives.

Read →
Intelligence

Hotel F&B Intelligence 2026: Why Dashboards Aren't Enough

Dashboards show what happened. AI agents tell you what to do about it.

Read →
3 outlets × 40 items each
= 120 SKUs to track
agents handle all 120
you handle the guests
before: 4hrs pulling data
after: 10 sec ask agent
spreadsheet → email → meeting
just open console
GM: "how's the restaurant?"
wait for report
→ ask your console

Built for the people running
hospitality's F&B operations.

The Hotel F&B Director

You manage multiple outlets, each with different menus and cost structures. You need one place to see everything and know what to act on first.

The Resort GM

You see the revenue numbers but need the story behind them. Why is the restaurant getting "overpriced" reviews when margins are healthy? Your agents tell you.

The Restaurant Group Operator

Multiple venues, multiple POS systems, no unified view. Each property gets its own console and agents trained on its data.

The Owner or Investor

You want to know if the operation is healthy without calling a meeting. Open your console, ask a question, get a straight answer.

Same platform, different intelligence. Each business type gets agents calibrated to its benchmarks, cost structures, and what actually matters.

🍽

Restaurants

Food cost %, menu engineering (Kasavana-Smith), item-level margin, guest review cross-referencing.

🏨

Hotels & Resorts

Multi-outlet performance, outlet-level P&L, procurement across properties, guest sentiment by outlet.

🍸

Bars & Nightlife

Revenue segment mix, commission-based payroll (35-50% normal), daily pattern analysis, break-even by night.

Cafes & Bakeries

High-volume low-ticket optimisation, daypart analysis, wastage tracking, recipe cost per unit.

🎤

Entertainment Venues

Beverage-heavy revenue, event-driven demand, seasonal staffing, fixed vs variable cost analysis.

🏢

Multi-Venue Groups

Consolidated view across properties. Each venue gets its own console and agents. You get the portfolio picture.

"I used to spend half a day pulling numbers from three outlets. Now I ask the agent and get the answer in 10 seconds."
— F&B Director, boutique resort
encrypted API ✓
no model training ✓
private console ✓
your data = yours
works with:
Wongnai ✓ FoodStory ✓
Loyverse ✓ Square ✓
messy Excel ✓
Q: "do I need IT?"
A: no.
browser. that's it.

Questions we get every week.

Each console comes with Vera, an AI advisor that thinks like an experienced operator, with three specialist modes: Finance (follows the money from delivery to plate), Pulse (connects guest sentiment to margin data), and Ops (spots patterns in demand, staffing, and suppliers). Ask WhiteSpace anything in plain language. She diagnoses before prescribing, speaks with conviction, and uses only your data. Vera also has conversation memory: she remembers your preferences, past discussions, and decisions across sessions, so you never have to repeat yourself.

A POS export and your cost sheets. We work with any POS: Wongnai, FoodStory, Loyverse, Square, Lightspeed, or a plain Excel file. WhatsApp or email us whatever you have. We handle the mapping, cleanup, and structuring. Most consoles are live within 48 hours of receiving your data.

Yes. Each console is private to your property. No data is shared between clients. Your information is processed through encrypted APIs and never used to train AI models. We don't store chat history on our servers. Your data stays yours.

Your console is updated with every reporting cycle, typically weekly or monthly depending on your preference. When new data comes in, your agents immediately have access to the latest numbers. No manual refresh needed on your side.

Yes, that's one of the most powerful features. When guests say a dish is "overpriced" but your food cost is 34%, the agents identify it as a presentation or portion issue, not a pricing problem. They cross-reference review sentiment, social media engagement, and financial performance to give you the full picture.

Each property gets its own console with agents trained on its specific data: different menus, different cost structures, different guest profiles. You can manage multiple consoles from the same account. Group-level insights are on our roadmap.

No. Your console runs in the browser. Desktop, tablet, or phone. No software to install, no app to download, no IT department needed. Just open the link and start asking questions.

BI dashboards show you charts and leave you to figure out what they mean. WhiteSpace agents tell you what's wrong, why it matters, and what to do about it. In plain language. No training, no filters to configure, no learning curve. You ask a question, you get a direct answer with a recommended action.

send data → 48hrs → live
free first console
no credit card
food cost:
bev cost:
labour:
guest sentiment:
all connected
Week 1: data in
Week 2: first insight
Week 4: "why didn't we
do this sooner?"

See what your data
is really saying.

Send us a POS export or cost sheet. We'll build a private console with three AI agents trained on your numbers. Live within 48 hours. Your first property is on us.

whitespaceintelligence@outlook.com
WhatsApp: +66 82 281 6582  ·  @whitespace  ·  LinkedIn
Your data stays yours. We never share your financial data.
Chat with us on WhatsApp